
: Pioneering Rehabilitation with Cutting-Edge Technology")

: A Strategic Investment in Life-Changing Therapies")
: Pioneering RNAi Therapeutics with Vutrisiran Expansion")
: Pioneering Breakthroughs in Central Nervous System Therapies")
: Progress in Rare Respiratory Disease Treatment with MOLBREEVI")

 Receives an Order of $10.8 Million for Production Test of Silicon Carbide Semiconductors")
 Could React on New Aegea Rapid Test News")


Markets continue their float higher as selling pressure seems to be waning. Volatility is finally starting to make a meaningful contraction, with the VIX down over 10% on the day.

VIX Hourly Chart
If the VIX starts closing below $50 on a dail basis, we could see the VIX start to come in quickly. However, that won’t necessarily mean the market runs that much further.
We’re probably seeing the equity run wane but not roll over. This is leading to more people lightening up on their protection the longer this goes on.
Additionally, we still haven’t seen the VVIX move off yet, but it also hasn’t held up as well.

VVIX Hourly Chart
The key level here is $150. Daily closes below this spot should bring the VVIX down do around $120 (which is still pretty darn high.
Bonds are really interesting. They’re holding in this range that keeps narrowing down. Typically, this means they’re about to break out with an expansive move. That could be something we see sooner rather than later.

TLT Daily Chart
Similarly, we’re seeing the dollar follow a pattern where it started in a wide range and then moved back into a more narrow path.
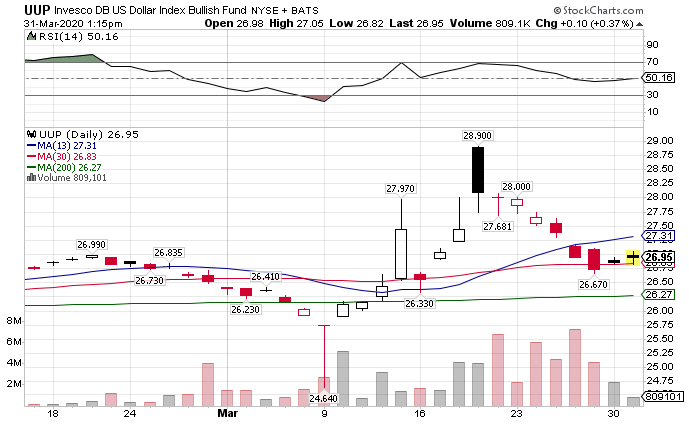
UUP Daily Chart
: Revolutionizing Data Protection with the DXi9200 to Strengthen Cyber Resilience")
: Pioneering Rehabilitation with Cutting-Edge Technology")
: A Transformative Acquisition by Renovaro Inc.")
: Pioneering Breakthroughs in Central Nervous System Therapies")

: Progress in Rare Respiratory Disease Treatment with MOLBREEVI")